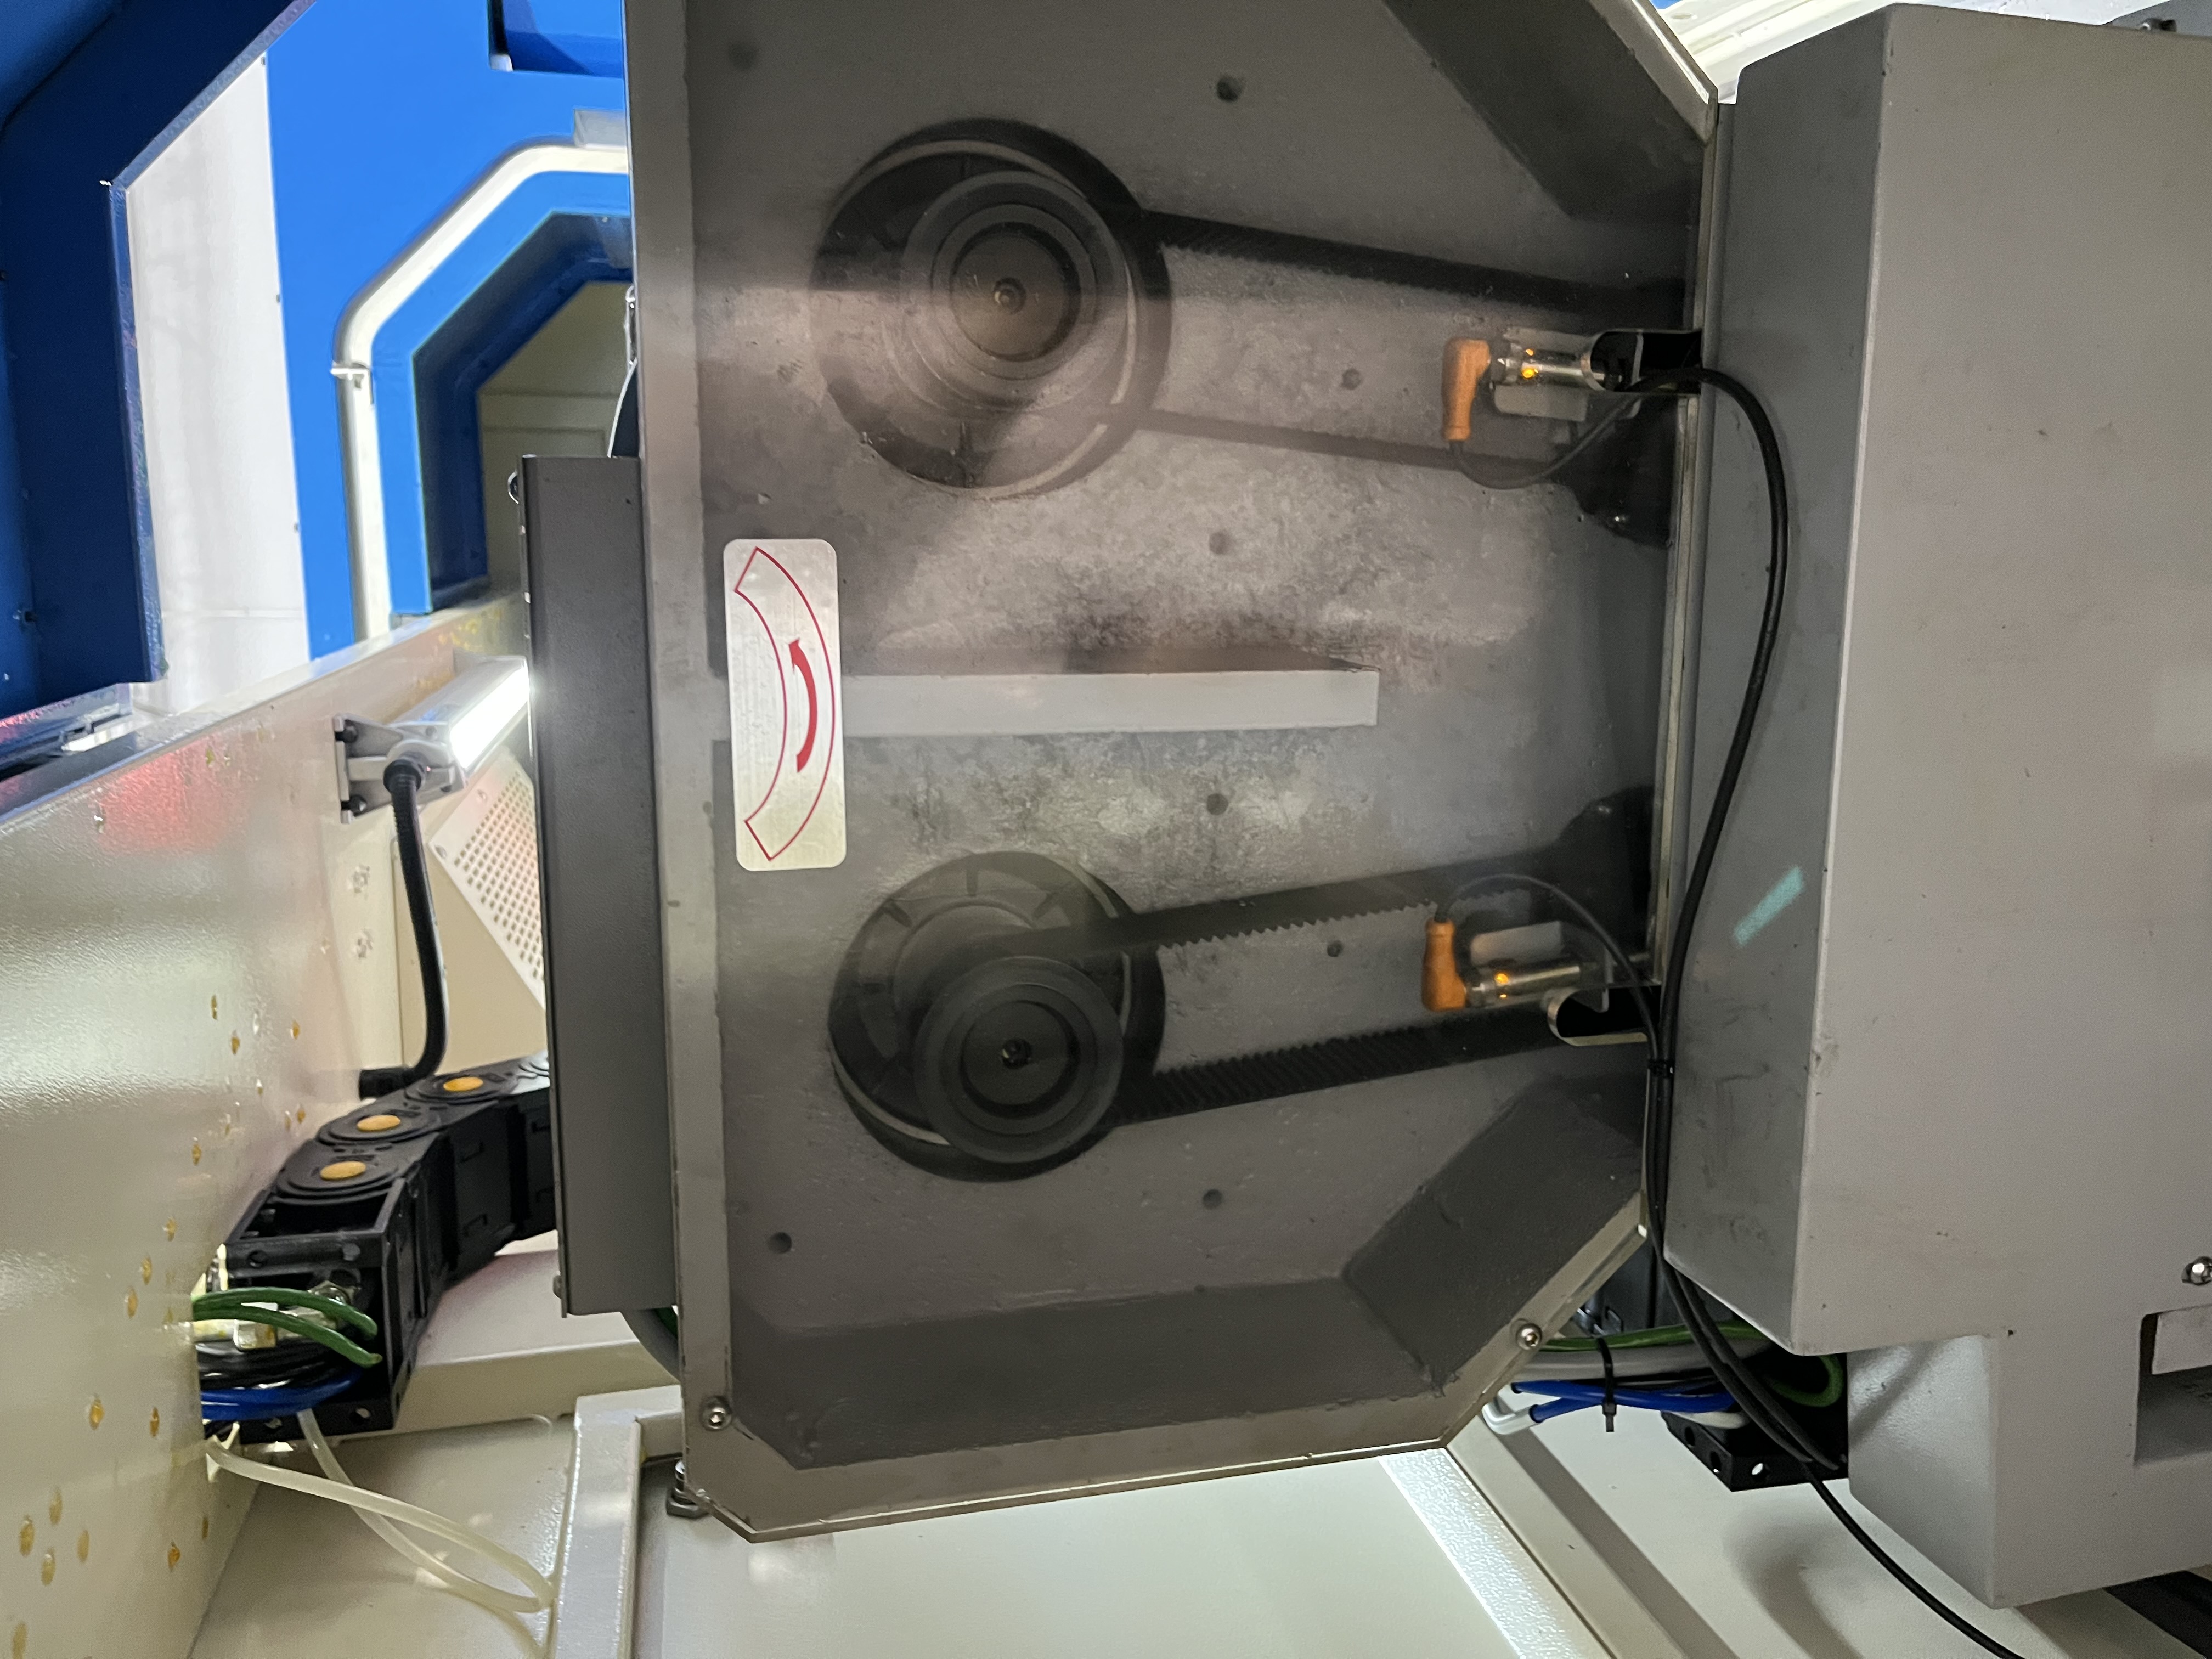
Monitoring the drilling process in real time helps catch problems before they cause scrap. I have used various sensors and monitoring systems on deep hole drilling machines over the years. The right monitoring setup depends on the type of work you do and the investment you are willing to make. Here is what I have learned about deep hole drilling machine monitoring.
What to Monitor
The most useful parameters to monitor on a deep hole drilling machine are coolant pressure, spindle load, and feed force. These three catch the majority of process problems before they turn into scrap parts or broken tools.
| Parameter | What It Shows | Sensor Type | Recommended Range | Priority |
|---|---|---|---|---|
| Coolant pressure | Pump condition, chip evacuation health | Pressure transducer | 0-3000 psi (0-207 bar) | Critical |
| Coolant flow | Pump output, blockage detection | Flow meter | 0-50 L/min | High |
| Spindle load | Tool condition, chip packing, material variation | Current sensor / power meter | 0-200% of rated power | Critical |
| Feed force | Tool condition, material variation, bushing wear | Load cell | 0-5000 N | High |
| Temperature | Coolant system condition, process stability | Thermocouple | 0-100 deg C | Medium |
| Vibration | Tool condition, chatter, bearing wear | Accelerometer | 0-50 g | Medium |
| Hole depth | Process progress, tool position, breakage detection | Encoder / linear scale | 0-2000 mm | High |
The two most important sensors are coolant pressure and spindle load. These catch most process problems. Everything else adds useful information, but I would not call any of the other sensors essential for basic monitoring.
Monitoring System Types Comparison
There are several levels of monitoring systems available. Here is how they compare based on what I have used:
| System Type | Sensors Included | Data Output | Cost Range | Best For |
|---|---|---|---|---|
| Manual log sheet | None (operator reads gauges) | Paper log | Near zero | Small shops, low-volume work |
| PLC-based basic monitoring | Coolant pressure, spindle load | Digital readout on HMI | $500-2000 | Production shops with standard machines |
| PC-based data collection | All machine sensors | Trend charts, data export | $3000-8000 | High-volume production, process optimization |
| Industry 4.0 adaptive control | All sensors plus closed-loop control | Real-time adjustment, data logging | $10000-30000 | Critical parts, aerospace, medical |
| Cloud-connected system | All sensors plus remote access | Dashboards, alerts, analysis | $15000-50000 | Multi-machine facilities, remote monitoring |
I started with manual log sheets and worked my way up to a PC-based system. The jump from manual to digital monitoring paid for itself within six months through reduced scrap and fewer broken tools.
Coolant Pressure Monitoring
Coolant pressure is the most direct indicator of process health. A steady pressure means good chip evacuation. A rising pressure means chips are starting to pack. A dropping pressure means a coolant leak or pump problem.
I set up the machine to alarm if the pressure deviates more than 15 percent from the setpoint during steady drilling. The alarm alerts the operator to check the process before the drill breaks. A slow pressure rise over several seconds gives the operator time to respond. A sudden pressure drop usually means a coolant line has burst or a fitting has failed.
The pressure sensor should be located as close to the tool tip as possible. A sensor at the pump reads higher than the pressure at the tool because of line losses. On machines with rotary unions, I place the sensor on the outlet side of the union. This catches both pump problems and rotary union seal failures.
Spindle Load Monitoring
Spindle load is the second most useful parameter. The load increases as the tool wears and decreases if the tool breaks. Modern adaptive control systems can even detect material transitions by monitoring the derivative of the spindle load curve.
I track the baseline load for each job. A 20 percent increase from baseline typically indicates tool wear. A sudden drop of more than 30 percent indicates a broken tool. I set the control to alarm at a 20 percent increase and stop at a 50 percent drop. The difference between the alarm and stop thresholds gives the operator a window to evaluate the trend.
Newer systems like DMG MORI Adaptive Drilling Control take this further by using closed-loop control. The system continuously captures coolant pressure, flow rate, and spindle load, then adjusts parameters in real time. These systems report up to 30 percent longer tool life and significant energy savings.
Sensor Placement and Data Analysis
Getting useful data depends on where you place the sensors. Here are the placement rules I follow:
| Sensor | Placement Rule | Reason |
|---|---|---|
| Coolant pressure | Within 300 mm of spindle outlet | Minimizes line loss effect on reading |
| Coolant flow | On pump outlet line | Measures total system output |
| Spindle load | Built into drive or external current sensor | Reads actual motor consumption |
| Feed force | Behind guide bushing holder or on tailstock | Reads actual cutting forces |
| Vibration | On spindle housing near front bearing | Detects tool and bearing issues |
| Temperature | In coolant tank return line | Measures system heat load |
For data analysis, I look at trends rather than absolute values. A spindle load that increases by 2 percent per hour is normal tool wear. A spindle load that jumps by 15 percent in one cycle is a problem. Trend monitoring catches problems earlier than fixed threshold alarms.
I set alert thresholds based on historical data from the first five good parts. The standard deviation of each parameter during stable cutting gives me the baseline for setting limits. I use three standard deviations as the warning threshold and five as the alarm threshold. This statistical approach reduces nuisance alarms while catching real problems.
Alert Thresholds for Common Parameters
| Parameter | Warning Threshold | Alarm Threshold | Response |
|---|---|---|---|
| Coolant pressure deviation | +/- 10% from setpoint | +/- 15% from setpoint | Check pump and lines |
| Spindle load increase | +15% from baseline | +25% from baseline | Inspect tool condition |
| Spindle load decrease | -20% from baseline | -40% from baseline | Check for broken tool |
| Feed force increase | +20% from baseline | +30% from baseline | Check bushing and chip evacuation |
| Vibration level | +50% from baseline | +100% from baseline | Check tool and spindle bearings |
| Coolant temperature | Above 50 deg C | Above 60 deg C | Check cooler and tank level |
For more on related process monitoring, see my article on torque limits and breakage prevention. The combination of real-time monitoring and torque limits provides layered protection for the tool and the workpiece.
Key Takeaways
- Process monitoring does not need to be complex to be useful — a coolant pressure gauge and a spindle load readout catch most problems
- Coolant pressure is the single most important monitoring parameter for deep hole drilling because it directly indicates chip evacuation health
- Trend monitoring catches problems earlier than fixed threshold alarms — look at the rate of change, not just the absolute value
- Sensor placement matters: place pressure sensors close to the tool tip, not at the pump, for accurate readings
- Modern adaptive control systems like DMG MORI ADC provide closed-loop parameter adjustment based on real-time sensor data
- I use three standard deviations as the warning threshold and five standard deviations as the alarm threshold based on data from the first five good parts
- The most effective monitoring setup is the one that operators actually use — a simple system with clear alarms beats a complex system nobody understands