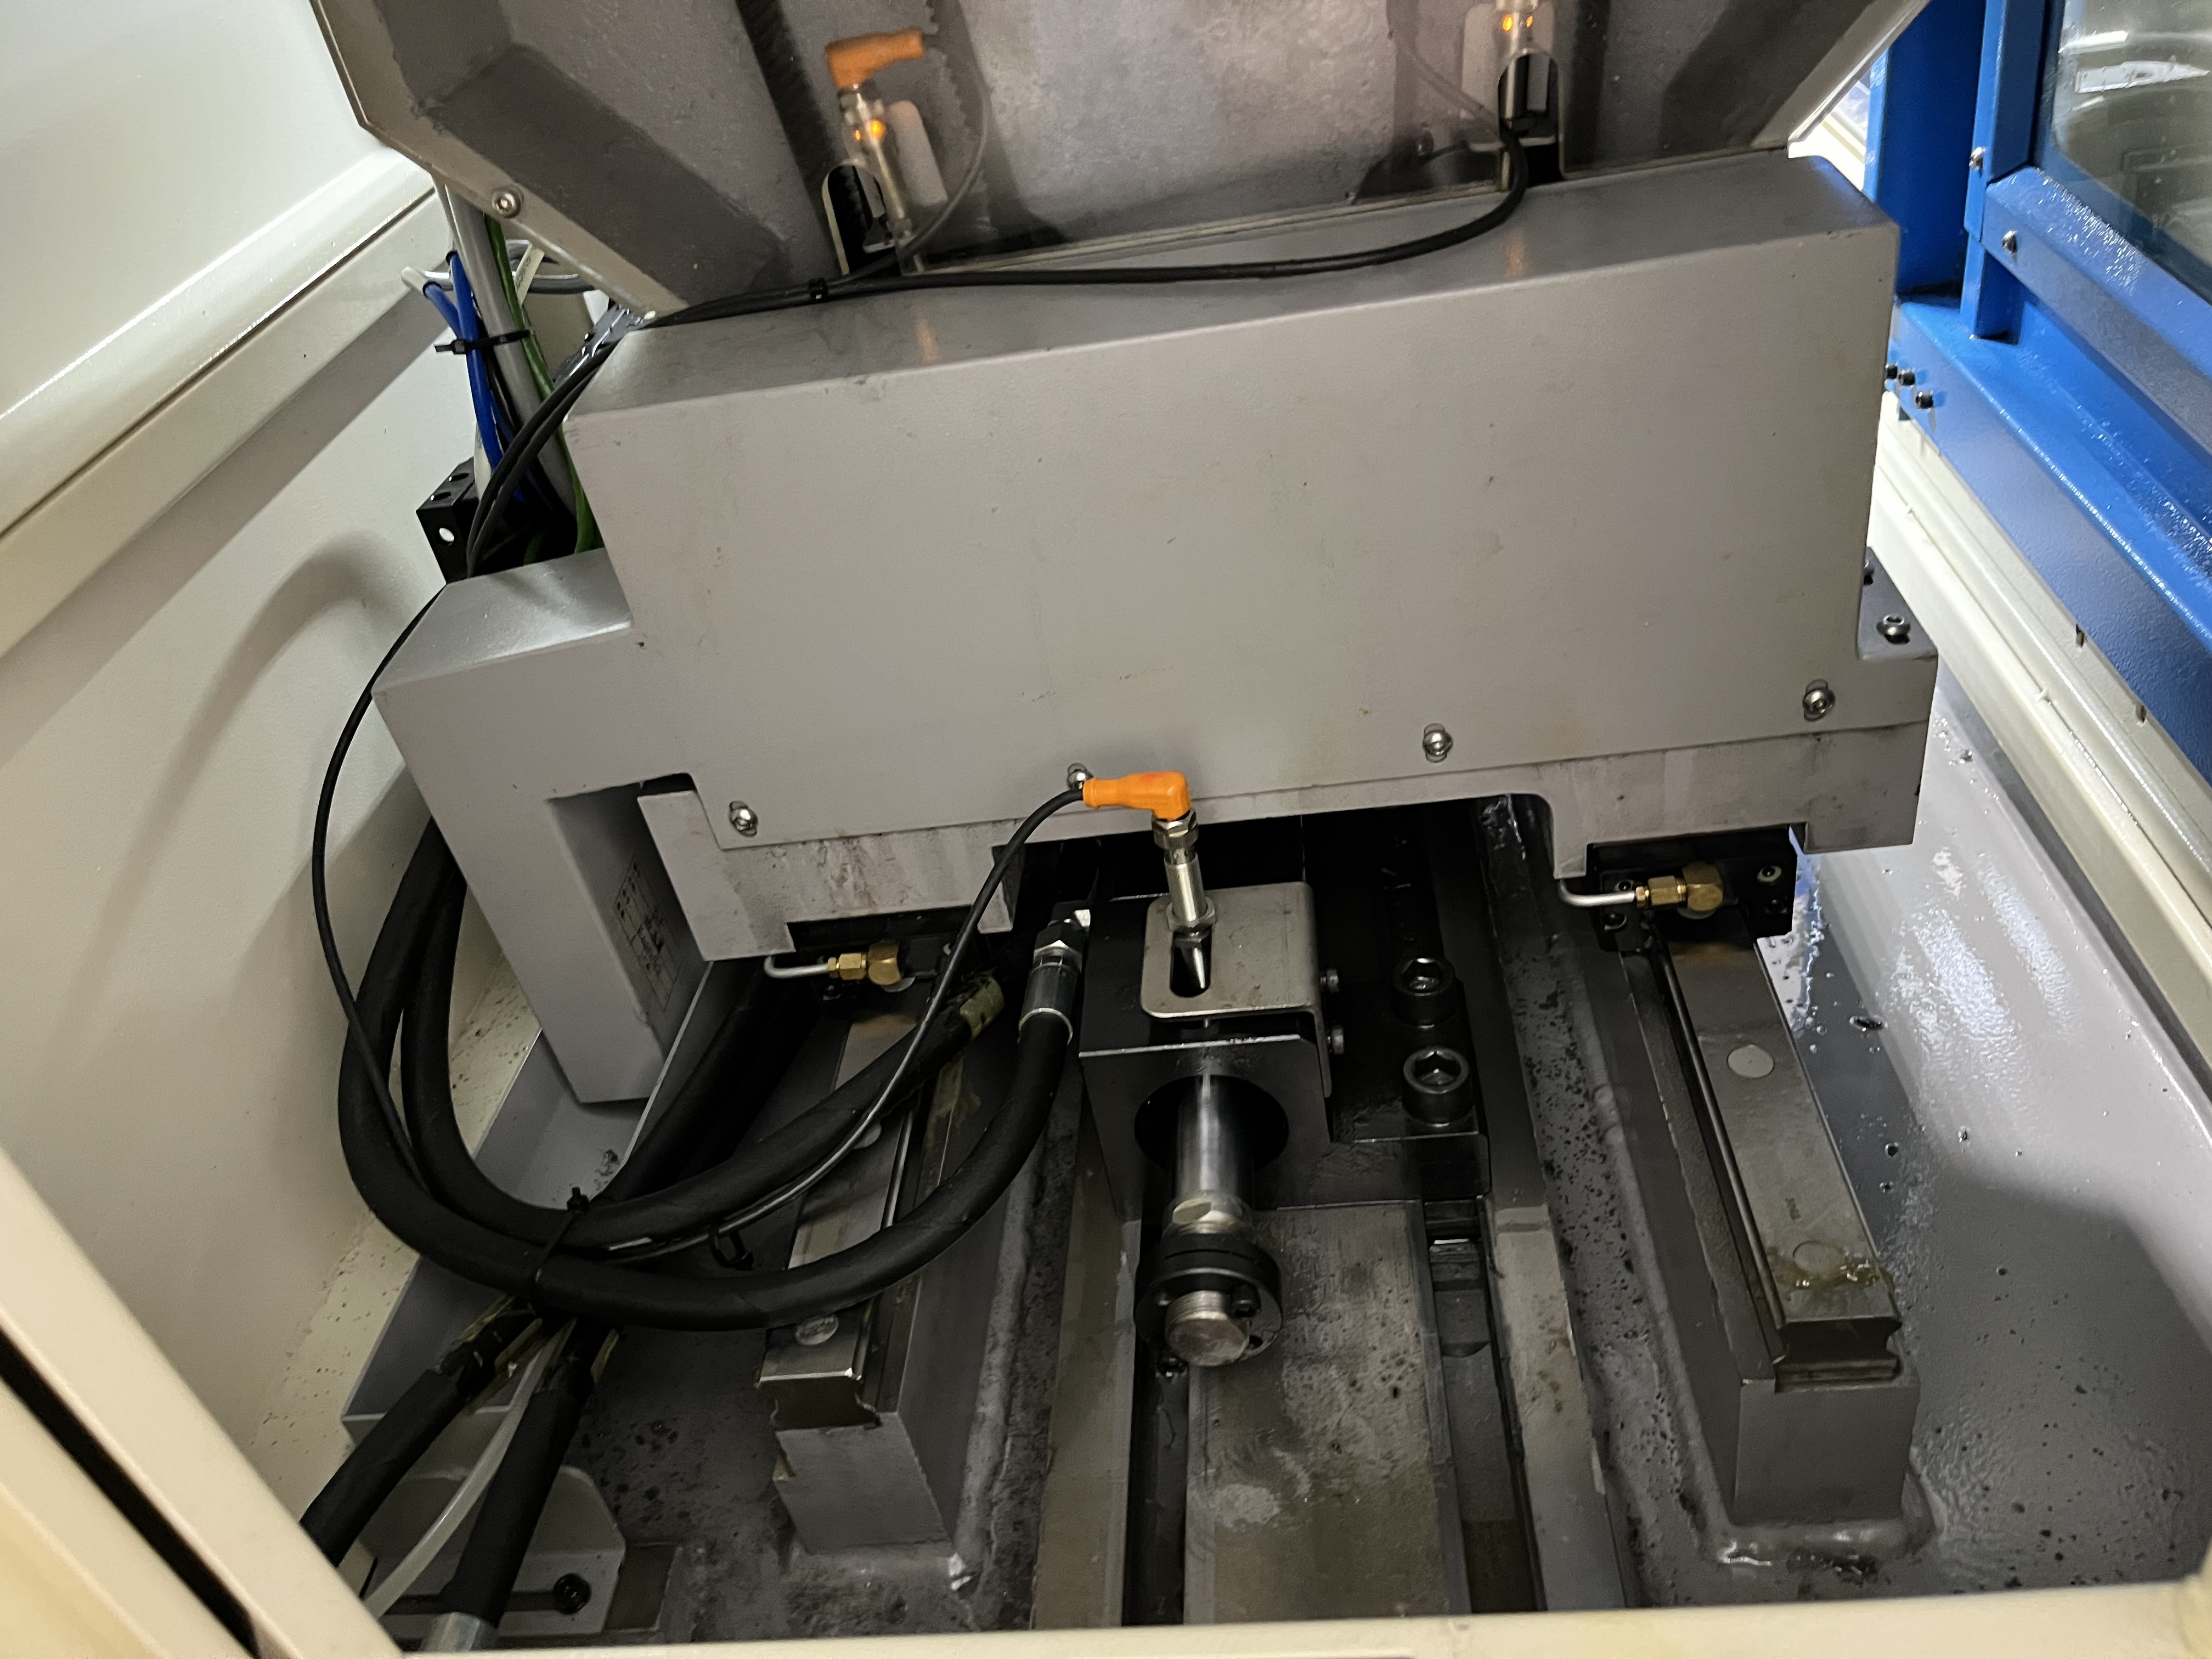
Spindle load monitoring uses the spindle drive current to measure the cutting load. Changes in the load indicate changes in the process. The drive amplifier converts the mechanical torque into an electrical current signal. The CNC reads this signal and displays it as a percentage of the drive’s rated capacity. In my experience, this single data stream catches more process problems than any other sensor on the machine.
Establishing the Baseline
I record the baseline spindle load for each job using a new tool. The baseline is typically 30% to 50% of the spindle drive capacity. I note the load for each stage of the cycle: entry, steady cutting, and exit. Each stage produces a characteristic load signature.
For a typical BTA drilling operation with a 40 mm diameter tool at 2500 RPM and 0.05 mm/rev feed, the load profile looks like this:
| Cycle Stage | Duration (seconds) | Load (% of drive) | Typical Variation | What It Tells Me |
|---|---|---|---|---|
| Tool approach (no cut) | 5 | 5 - 10 | 0% | Idle load — bearing drag and seal friction |
| Entry (pilot hole contact) | 15 | 20 - 35 | +- 5% | Edge engagement — confirms contact is even |
| Steady cutting | 120 - 600 | 40 - 55 | +- 3% | Normal cutting — baseline for tool wear tracking |
| Breakthrough | 10 | 35 - 60 | +- 10% | Exit transition — load drops as drill exits |
| Retract | 30 | 10 - 15 | +- 2% | Return to idle — verifies no drag on retract |
I save these baseline values in a spreadsheet that maps job number to expected load range. New operators can reference this table during setup to verify the machine is cutting within parameters before unattended cycles begin. I cover the overall approach in my article on process monitoring in deep hole drilling.
Spindle Load Pattern Reference Table
Different process problems produce different load patterns. I use this reference to diagnose issues from the load trace alone:
| Load Pattern | What It Indicates | Typical Root Cause | Urgency |
|---|---|---|---|
| Gradual rise over 10-30 parts | Tool wear | Dulling cutting edge | Change tool at 120% of baseline |
| Sudden spike > 150% (under 1 sec) | Chip packing | Coolant pressure drop or clogged flute | Immediate stop — risk of tool breakage |
| Gradual rise within a single hole | Chip accumulation | Flute clogging, chip former too small | Reduce feed, increase coolant pressure |
| Cycling load (sawtooth pattern) | Stick-slip on guide pads | Pad geometry or bushing wear | Inspect guide pads |
| Low-frequency oscillation (1-3 Hz) | Chatter | Pad lag too short or speed resonance | Adjust speed or pad geometry |
| Load drop during steady cutting | Material soft spot or drill fracture | Hardness variation or broken edge | Stop and inspect tool |
| Load rise after tool change (new tool > baseline) | Tool runout or misalignment | Collet or bushing not centered | Check tool clamping |
Detecting Tool Wear
A gradual load increase over several parts indicates tool wear. The cutting edges dull, which increases friction and requires more torque to remove the same volume of material. I change the tool when the load reaches 120% of the baseline steady-state value. Waiting beyond 130% risks a catastrophic tool failure inside the bore.
Here is a real example from a gundrill job running 200 mm deep holes in 4140 steel:
| Part Number | Steady Load (%) | Tool Condition | Action Taken |
|---|---|---|---|
| 1 - 10 | 42 - 44 | New / fresh | None |
| 11 - 25 | 44 - 47 | Normal wear | None |
| 26 - 35 | 47 - 52 | Moderate wear | Monitor |
| 36 | 54 | Worn | Tool change |
| 37 | 43 | New tool installed | Cycle resumed |
The load curve told me exactly when to change the tool, and I never had to guess based on hole count alone. Part count varied by plus or minus 12 pieces across different batches due to material hardness variation, but the load signal was consistent.
Threshold Setting Guide
Setting the right thresholds is critical — too tight and you get nuisance trips, too loose and you miss problems. Here is my approach:
| Threshold Type | Value | Hold Time | My Logic |
|---|---|---|---|
| Upper steady-state limit | 120% of baseline | 1 second | Tool wear threshold — change tool |
| Upper emergency limit | 150% of baseline | 0.3 seconds | Chip packing or tool breakage — stop immediately |
| Lower limit | 70% of baseline | 2 seconds | Tool breakage (load drops) or coolant loss |
| Rate of change limit | 10% increase per hole | 3 consecutive holes | Gradual wear progression |
| Rate of change limit (within hole) | 20% over 5 seconds | Immediate | Chip accumulation — reduce feed or increase coolant |
I adjust the lower limit based on the machine’s idle load. A machine with 10% idle load should have a lower limit around 20% (idle plus a small cutting margin). If the load drops below that during a cut, the drill most likely broke.
Recognizing Process Abnormalities
A sudden load spike indicates chip packing or a material hard spot. The control can be set to stop the machine at a 150% load threshold. In my experience, a spike above 150% that lasts longer than 0.5 seconds already means the tool has damage. A threshold of 130% with a 0.3-second hold time gives better protection without nuisance trips.
I have also used load monitoring for:
- Coolant pressure failure. If the coolant pressure drops and chip evacuation suffers, the spindle load increases because the chips are packing in the flute. The load increase often happens 30 to 60 seconds before the operator notices the coolant pressure change on the gauge.
- Guide bushing wear. A guide bushing that is opening up allows the drill to wander, which increases the bending moment on the tool and drives up the load reading. I have caught two cracked bushings this way.
- Material hardness variation. Some steel batches arrive with hardness 10 to 15 points above spec. The spindle load rises proportionally. I adjust feed rate to maintain a consistent load, which protects tool life.
Data Interpretation Guide
I review the load data after each production run to identify opportunities for process improvement. Here is what I look for:
| Data Point | What to Look For | Action If Abnormal |
|---|---|---|
| Average steady load | Should be consistent within +-3% across parts | Check material batch, tool condition |
| Load at entry | Should increase smoothly over 5-15 seconds | Sudden jump means pilot alignment issue |
| Load at breakthrough | Should drop cleanly when drill exits | Load rise before exit means chip packing |
| Load variation within a hole | Should stay within +-3% of average | Higher variation means vibration or coolant issue |
| Load after retract | Should return to idle load within +-2% | Higher retract load means chips stuck in flute |
I covered more detail on troubleshooting from load data in my article on interpreting machine monitoring data.
Setting Up the Operator Display
I set up the CNC control to display spindle load on the main screen. The operator can see the load trend during the cycle. An experienced operator notices when the load pattern changes and investigates. The display should show three items at a glance:
- Current load percentage as a bar graph
- Peak load recorded during the most recent cycle
- The baseline load for the current job
I also configure a load vs. time trend screen that shows the last 50 cycles. This lets the operator see the progression from one part to the next. A rising staircase pattern on this screen is unmistakable evidence of tool wear or process drift.
Key Takeaways
- Spindle load monitoring catches more problems than coolant pressure or temperature readings alone. It is a direct measurement of what the tool experiences during the cut.
- The load baseline varies by material and tool diameter. Do not rely on a single percentage across all jobs. Measure each combination.
- A load trend over many parts is more informative than the instantaneous reading. I review the trend weekly and archive it for future reference.
- Use the load pattern reference table to diagnose the root cause from the shape of the load trace — it saves hours of guesswork.
- Set thresholds at 120% for tool change and 150% for emergency stop, with appropriate hold times to avoid nuisance trips.
- I have caught several potential problems with spindle load monitoring. A gradual load increase on one job turned out to be a worn guide bushing that was causing the drill to bind. The load monitoring caught it before the drill broke. That alone paid for the monitoring system several times over.