Why Data Matters
Troubleshooting without data is guessing. I’ve watched operators change tools, adjust feeds, and tweak coolant pressure without any record of what was happening before the problem started. They fix things by accident and never know what actually worked.
Good data turns troubleshooting from a guessing game into a comparison exercise. When a problem appears, I compare the current readings to the baseline from when the job was running well. The difference between them points directly at the root cause.
What I Track
I collect data in three categories: process parameters (things I control), quality results (things I measure), and environmental conditions (things that change). Here is my full data collection table:
| Category | Parameter | When I Measure | Measurement Method | Target / Expected Range |
|---|---|---|---|---|
| Quality | Hole diameter (entry, mid, exit) | Every part | Air gage or bore mic | Within +/- 0.02 mm of nominal |
| Quality | Surface finish Ra | Every part | Profilometer | Ra 0.8 max for finish bores |
| Quality | Hole straightness | First part every setup | Precision mandrel or CMM | Within 0.1 mm per 100 mm depth |
| Process | Coolant pressure at tool tip | Start and end of cycle | Pressure transducer | Within +/- 5% of baseline |
| Process | Coolant flow rate | Weekly | Flow meter in return line | Within +/- 10% of nominal |
| Process | Spindle load | Continuous during cut | PLC spindle drive amp reading | Under 80% of drive rating |
| Process | Spindle speed and feed | Every setup | Control panel readout | Match program specification |
| Material | Chip shape and size | Visual every cycle | Operator visual inspection | Short broken segments |
| Material | Material heat number | Every batch | Mill certificate | Match PO specification |
| Material | Material hardness | Every batch | Hardness tester (HRC or HB) | Within spec range |
| Maintenance | Tool condition (before and after) | Every tool change | Visual at 10x magnification | No edge wear over 0.3 mm |
| Maintenance | Coolant concentration | Daily | Refractometer | Within +/- 0.5% of target |
| Environment | Coolant temperature | Start of shift | Thermometer in tank | 20-30 degrees Celsius |
| Environment | Shop temperature | Daily | Shop thermometer | 18-26 degrees Celsius |
I also record the material heat number and hardness for every production batch. I have traced bore quality problems to a single bad heat of 4140 that was 5 HRC points harder than the previous batch. Without that material data, I would have chased machine issues for days.
Data Collection Template
I designed a one-page log sheet that captures everything I need without taking more than 2 minutes per part. Here is the structure I use:
| Part # | Dia Entry | Dia Mid | Dia Exit | Ra | Pressure Start | Pressure End | Spindle Load % | Chip Type | Tool Use # | Coolant Temp | Initials |
|---|---|---|---|---|---|---|---|---|---|---|---|
| 001 | 12.015 | 12.012 | 12.010 | 0.6 | 1200 | 1180 | 45 | Broken | 15 | 26 | JM |
| 002 | 12.013 | 12.011 | 12.009 | 0.5 | 1200 | 1175 | 46 | Broken | 15 | 26 | JM |
| 003 | 12.014 | 12.013 | 12.012 | 0.7 | 1195 | 1160 | 48 | Mixed | 15 | 27 | JM |
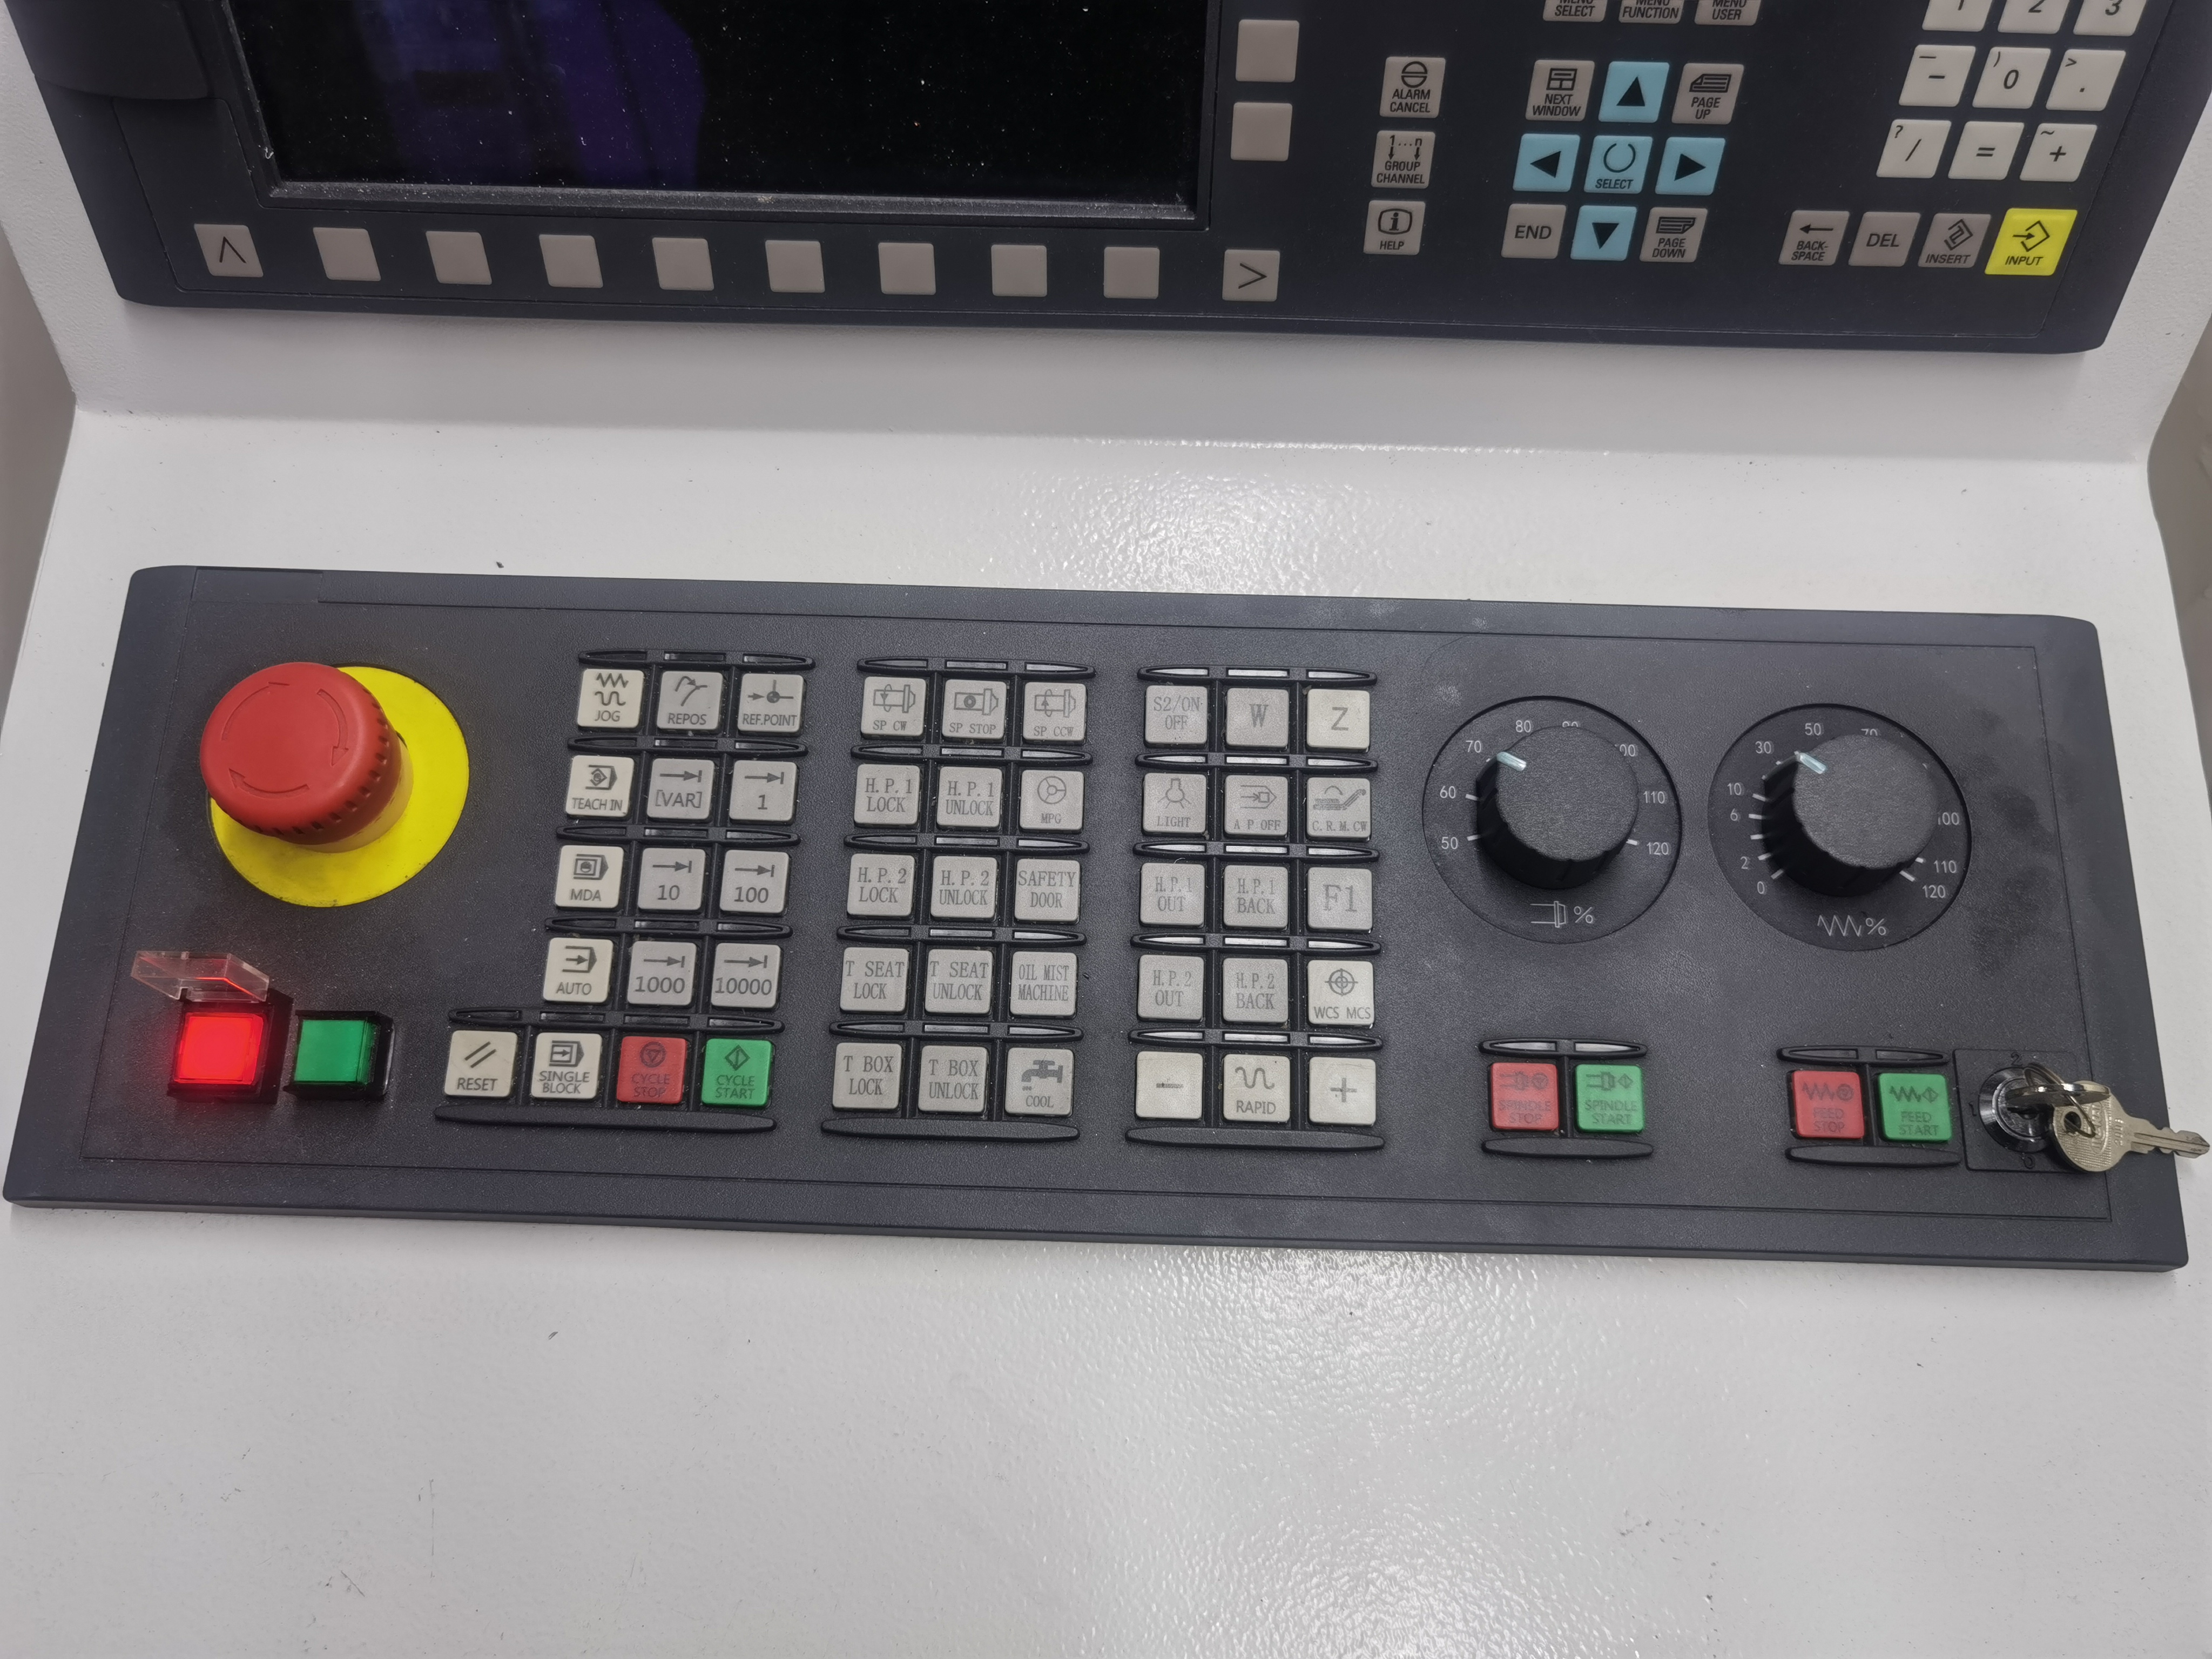
The sheet lives in a clear plastic sleeve on the machine control panel. I use a pencil so the operator can erase and correct entries. At the end of the shift, the sheets go into a job folder organized by date. If a problem shows up on the next shift, the data is right there for comparison.
Setting Baselines
Every new job gets a baseline run of five parts under ideal conditions. I record all the parameters and take photos of the chips. The baseline data goes into a binder labeled by job number.
I also note the environmental conditions — coolant temperature, shop temperature, and coolant concentration. A 5-degree coolant temperature swing can change chip formation noticeably. If I do not record it, I cannot account for it.
When a job comes back for repeat production, I pull the baseline sheet and check if the current parameters match. If the coolant pressure is 5 bar lower than baseline, I investigate before running parts.
Reading the Data
The data tells a story when you read it in sequence. I look for trends across the last 20 parts:
| Trend | Likely Problem | Confirmation Check | Action |
|---|---|---|---|
| Diameter slowly increasing | Tool wear — nearing end of life | Check tool use count vs. expected life | Change tool at upper control limit |
| Diameter suddenly increasing (0.02+ mm) | Built-up edge broke off or drill chipped | Inspect drill tip at 20x | Replace drill, inspect bore for damage |
| Diameter gradually decreasing | Built-up edge forming on drill margins | Check coolant concentration and EP additives | Adjust coolant chemistry |
| Coolant pressure dropping over shift | Filter slowly clogging | Check filter pressure differential gauge | Clean or replace filter element |
| Coolant pressure dropping suddenly | Pump cavitation or major leak | Check pump suction line and coolant level | Fix leak or add coolant |
| Spindle load creeping up over parts | Chip packing or tool dulling | Listen for chip evacuation sound, check chips | Adjust peck cycle or replace tool |
| Spindle load spiking mid-cycle | Chip packing in the bore | Retract drill and check for chip plug | Clear chips before resuming |
| Surface finish degrading gradually | Coolant concentration dropping or BUE forming | Measure concentration with refractometer | Adjust coolant mix |
| Surface finish degrading suddenly | Vibration or spindle issue | Check vibration on spindle housing | See vibration troubleshooting |
| Coolant temperature rising across shift | Chiller overloaded or coolant volume low | Check chiller setpoint and tank level | Service chiller or add coolant |
I plot hole diameter on a simple run chart taped to the machine. The chart has the nominal diameter as a center line and upper and lower control limits at +/- 3 sigma from the baseline run. When the diameter hits the upper control limit, I change the tool. No guessing about tool life — the data tells me when.
Trend Interpretation in Practice
Here is how I use the trend data in a real troubleshooting scenario. Last month I had a job where the coolant pressure dropped steadily over two shifts while the spindle load crept up. The operator saw both trends independently but did not connect them. I checked the filter and found it partially clogged with fine aluminum chips from a previous job that had not been cleaned out. The clogged filter reduced coolant flow, which caused chip evacuation to degrade, which increased spindle load. Cleaning the filter fixed both trends.
This is why I track multiple parameters and look at them together. A single trend points at a symptom. Two or more trends pointing in the same direction identify the root cause. I also cross-reference this with tool regrind quality data — if the tool condition column shows a pattern of edge wear accelerating after the third regrind, I know the regrind quality is degrading.
Analysis Methods
Beyond the run chart, I use two additional analysis methods:
Moving average — I calculate a 5-part moving average of the hole diameter and plot it alongside the individual readings. The moving average smooths out part-to-part variation and reveals the underlying trend. A moving average that crosses a control limit is more significant than a single reading that does the same.
Before-and-after comparison — When I change a parameter (speed, feed, coolant pressure, or tool change), I compare the 5 parts before the change with the 5 parts after. If the average diameter shifts by more than 0.005 mm or the surface finish changes by more than 0.1 Ra, the change had a measurable effect. I record these comparisons in a log and build up a knowledge base over time.
For shops running automated cells, I set up the machine to log coolant pressure and spindle load automatically through the PLC. The trend charts update in real time on a screen next to the machine. Automated data is better, but paper is still better than nothing. The key is that the data gets used — a log that nobody reads is just paperwork.
Keeping It Simple
Data collection does not have to be complicated. The one-page log sheet with checkboxes and blanks for the key numbers takes about 2 minutes per part. The operator initials and stamps the time. That is a small investment for data that saves hours of troubleshooting per problem.
The sheet lives in a clear plastic sleeve on the machine control panel. No digging through binders to find it. At the end of the shift, the sheets go into a job folder organized by date. If a problem shows up on the next shift, the data is right there for comparison. I have found that operators who fill out the log consistently also catch process problems earlier than those who do not.
Key Takeaways
- I track 14 parameters across quality, process, material, maintenance, and environment categories for complete troubleshooting data.
- Data turns troubleshooting from guessing into a comparison exercise — compare current readings to baseline from the ideal run.
- I look at multiple trends together: a single trend points at a symptom, but two or more trends pointing in the same direction identify the root cause.
- I use moving averages to smooth part-to-part variation and before-and-after comparisons to measure the effect of parameter changes.
- Set baselines on the first five parts of every new job, including photos of the chips and environmental conditions.
- Plot diameter on a run chart with +/- 3 sigma control limits to determine tool change timing objectively.
- 2 minutes of data per part saves hours of troubleshooting per problem — and operators who fill out logs consistently catch problems earlier.